Sage200, Memory Leaks and the .net Garbage Collector
Recently we encountered a support call from a client where processing a large amount of Sales Ledger Invoices, i.e. > 2000 in a single batch, would encounter an OutOfMemoryException error. Given the volume of transactions, we calculated each transaction or invoice to be leaking or not releasing 700Kb of memory.
To replicate the issue, we set up the same import on our test environment and found we were encountering the same problem i.e. memory usage would grow and grow, until memory for the process was exhausted and the OutOfMemoryException error occurred.
I searched the Sage200 developer forum to see if anyone had encountered this issue; no-one had. I did however find, on a completely unrelated post, someone was forcing a full garbage collection using GC.Collect to release memory.
Nowhere in our IMan application have we had to explicitly manage memory in this way, but as we had nothing else we thought we’d at least try it out.
To make this efficient, we decided to collect every 200 invoices.
|
1 2 3 4 5 6 7 8 9 10 |
++i; if (i % 200 == 0) { //Wait for the thread to finish GC.WaitForPendingFinalizers(); //Force collection of any unused objects in memory GC.Collect(); } |
We re-ran the import, and voila, the memory issue disappeared, or more correctly memory usage would increase until GC Collect was called where then usage fell and available memory in windows would increase.
Whilst we had the problem solved, the solution had a foul stench about it, and we needed to the find the cause, whether it was our code or a Sage problem.
The first thing we did was to use Performance Monitor to query the various .net Memory performance counters for our application.
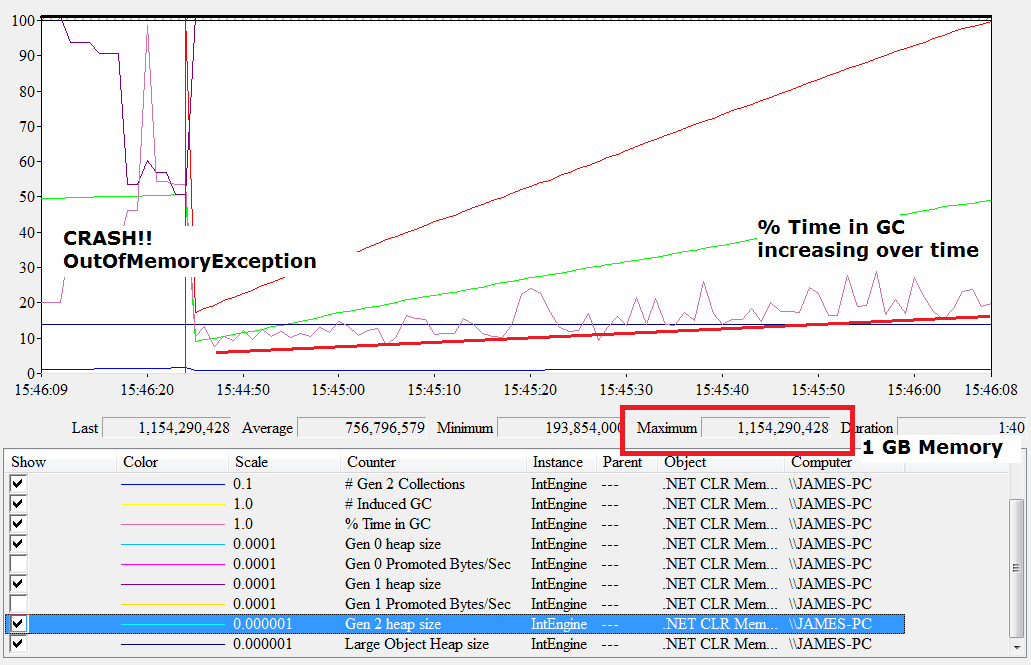
In the version of software which had the memory issue, two things stood out:
- ‘Gen2 Heap Size’ was massive; basically all memory was sitting in Gen2 waiting to be collected.
- ‘% of Time in GC’ was increasing over time until it spiked to 100% and the application subsequently crashed.

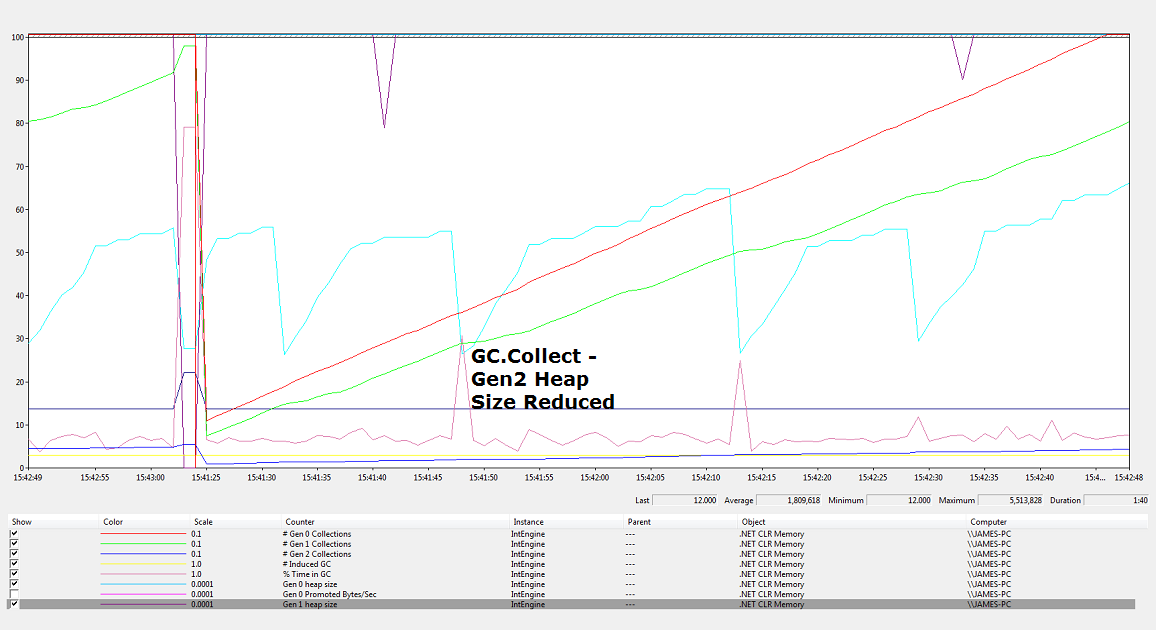
With the modified code using GC.Collect:
- Gen2 heap was reducing on each call.
- ‘% of Time in GC’ was remained relatively flat except for the spikes when we called GC.Collect.

What this was informing us was that we weren’t leaking memory, but there were a lot of objects accumulating in Gen2 waiting to be collected by the GC.
CLR Profiler
The next step was to identify which, or whose objects these were: our objects or Sage’s.
Whilst there are a lot of memory profilers available, the free CLR Profiler from Microsoft is actually pretty good. It provides a whole range of analysis but importantly it allows you to profile the .net garbage heap.
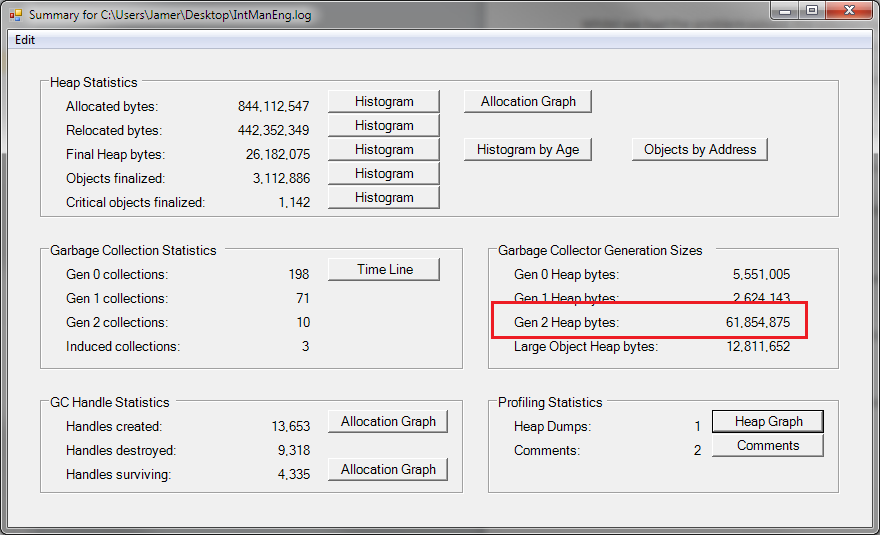
Using the Profiler, we decided to profile a batch of 200 invoices. After running we could immediately see a massive Gen2 Heap Size for a comparatively small number of invoices.

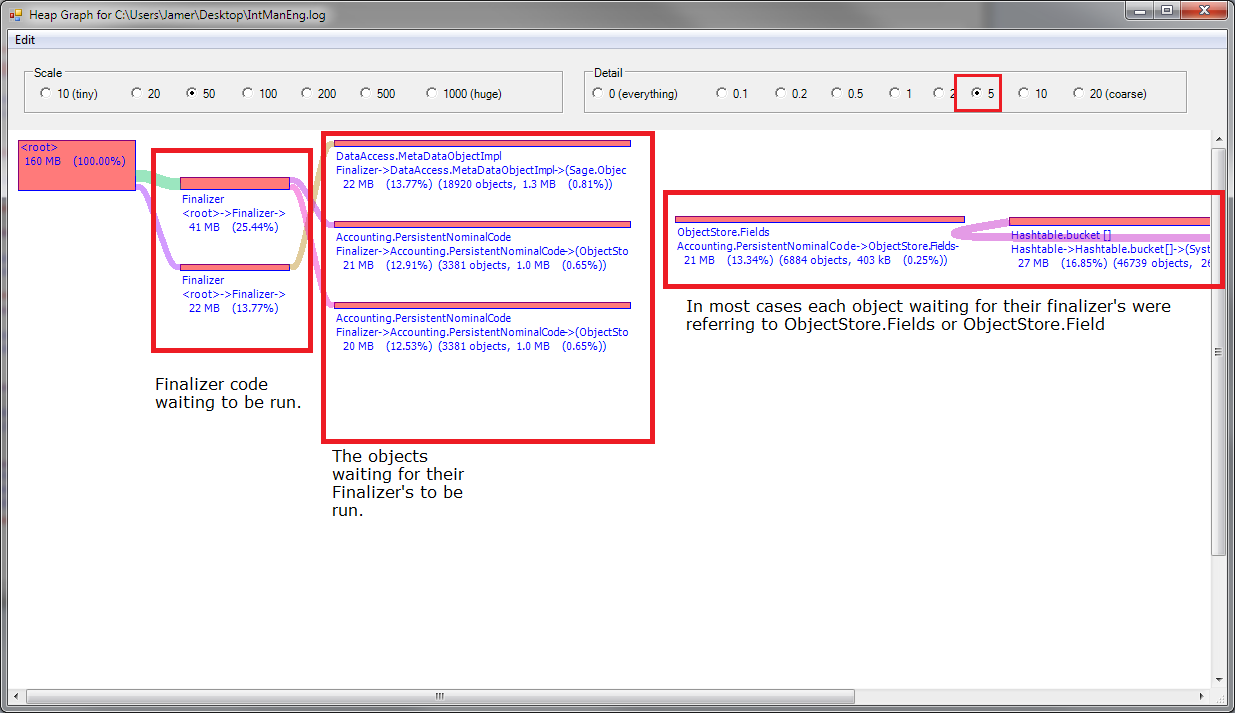
To find out which objects were sitting in the Gen2 heap, we viewed the Heap Graph.
Changing the detail to a relatively course mode, we could immediately see the majority of memory being used was indeed Sage objects waiting for their Finalizer to be run.

The Sage Response
We logged the issue with Sage after a little more testing to ensure it wasn’t our application and its running environment (under the hood we’re reasonably complex so I wanted to ensure the issue wasn’t related to that). Their response:
So Sage have exactly the same issue for some processes internal to Sage200. We’ve subsequently asked where the issue lay to which we’re awaiting a response.
General Issue
After further tests, we identified this issue applies to not only S/L Invoices but every Sage object inheriting from Sage.Common.DataAccess.BusinessObject i.e. any object used for data access in the Sage database.
Conclusion
We believe this is a fundamental bug/problem within the core of the Sage200 library, which needs resolving by R&D.
However, if you are processing large batches of any data using the Sage200 API, we highly recommend you implement a garbage collection mechanism to prevent ugly memory related errors.
Our issues show if you instantiate a Sage object in some sort of batch/continuous running process you will suffer a ‘memory leak’ and that object won’t be collected until you force collection.