Monitoring Installation & Setup
Monitoring needs two open-source packages beside IMan:
- Prometheus, which scrapes the metrics the WebAPI publishes and keeps them in a time-series database.
- Grafana, which draws them.
This page installs both on the IMan server itself, on Windows.
What the WebAPI publishes
The WebAPI serves its metrics at /IManWebAPI/metrics, in the Prometheus
text format, two series per endpoint, method and status code:
realisable_webapi_request_total, a counter of requests;realisable_webapi_request_time, a histogram of response times in milliseconds.
The route requires a bearer token from the IMan Authorisation Service, the same kind an OAuth web user obtains, so Prometheus has to be able to fetch one. Create a web user with the authentication type oAuth 2.0 for Prometheus and keep its Client Id and Client Secret for the configuration below. The user does not need to be assigned to any endpoint.
Prometheus installation and configuration
- Download Prometheus. There is no installer for Windows: unblock the zip and unzip it where you want it.
-
Open
prometheus.ymlin the root of the unzipped folder and add a job for the WebAPI underscrape_configs. The scrape goes over HTTPS with the token theoauth2block fetches;insecure_skip_verifyis only for a self-signed certificate.scrape_configs: - job_name: "webapi" metrics_path: /IManWebAPI/metrics scheme: https static_configs: - targets: ["imanserver"] oauth2: client_id: "<the web user's Client Id>" client_secret: "<its Client Secret>" token_url: https://imanserver:44390/connect/token scopes: ["httpListener_scope"] tls_config: insecure_skip_verify: true tls_config: insecure_skip_verify: true -
Run
prometheus.exefrom that folder. Prometheus must be running for anything to be collected.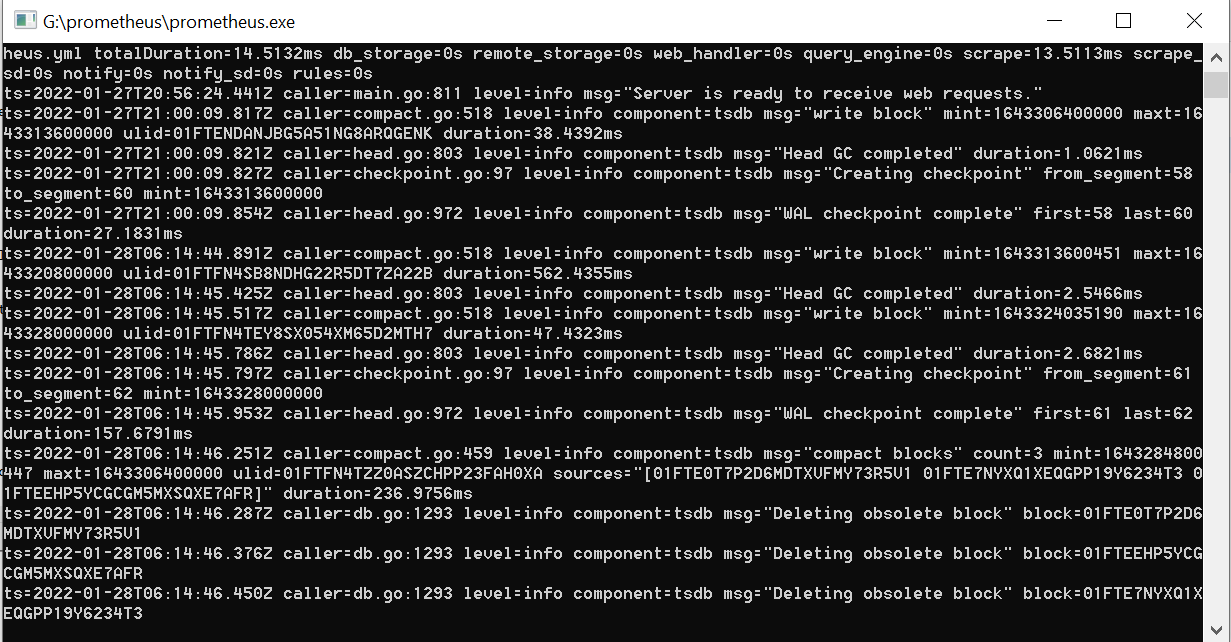
-
For a production server run it as a Windows service, with a wrapper such as AlwaysUp.
Prometheus's own page at http://localhost:9090/targets shows the scrape and
its last error, which is the place to look when the dashboard stays empty:
a 401 there means the token was refused.
Grafana installation and configuration
Download and install Grafana following the instructions on that page.
Data sources
Grafana needs two: Prometheus, for the metrics, and a SQL Server connection to the IMan database, from which the dashboard lists the endpoints.
Prometheus
- Open Grafana at
http://localhost:3000and sign in. The initial user and password are bothadmin; Grafana asks for a new password at once. -
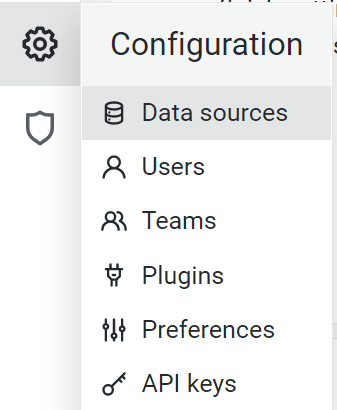
Open the Data sources menu.
-
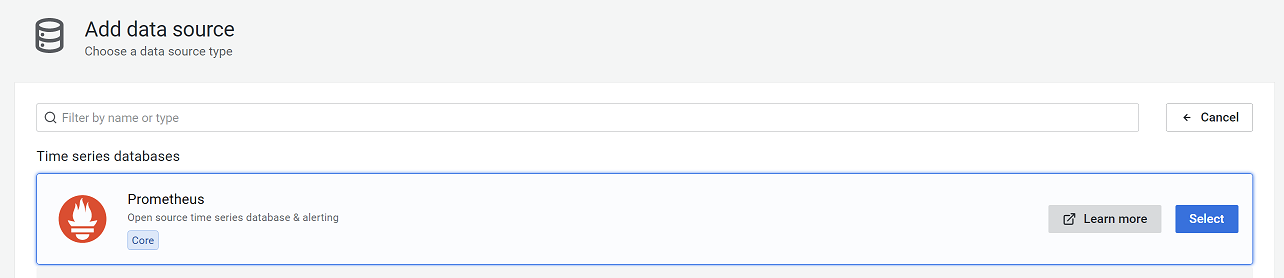
Add a Prometheus data source.
-
The one setting that matters is the URL. With Prometheus on the same server and its defaults,
http://localhost:9090is right.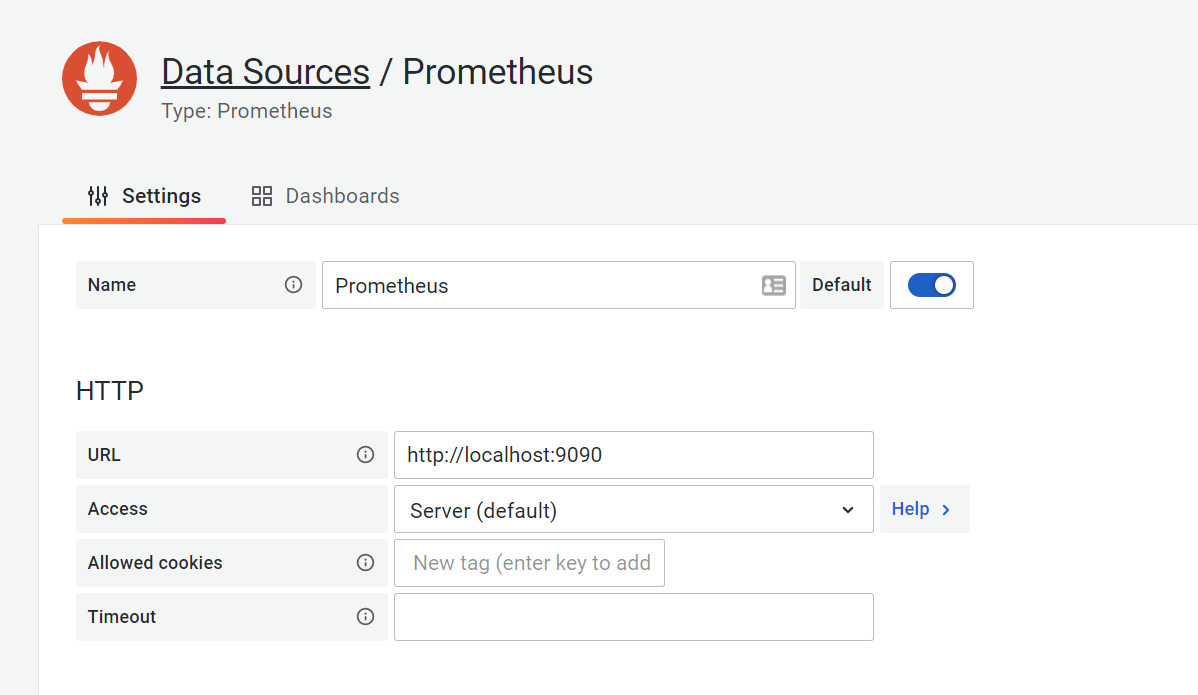
-
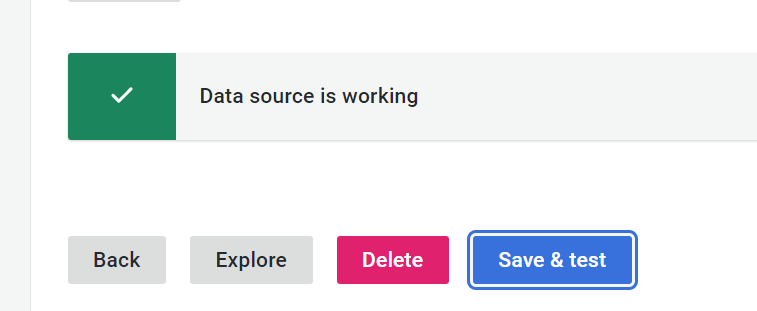
Press Save & Test.
IMan SQL Server
-
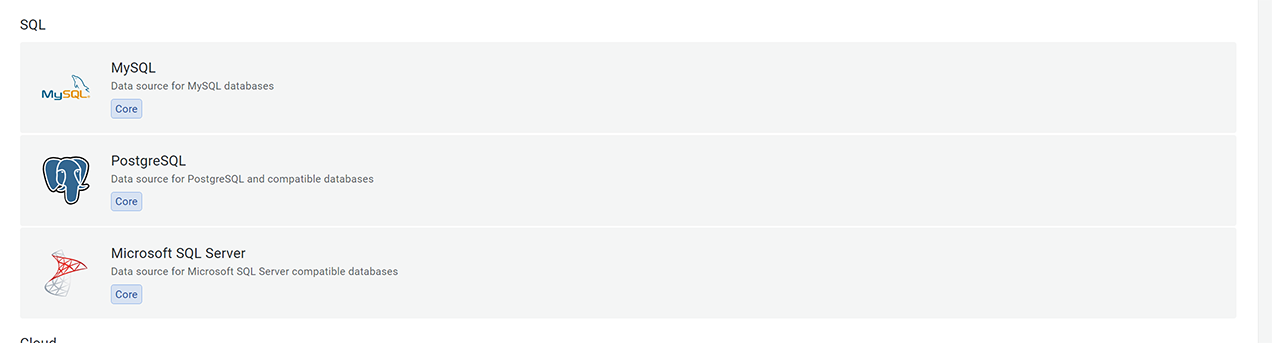
Add a Microsoft SQL Server data source; the SQL sources are two thirds of the way down the list.
-
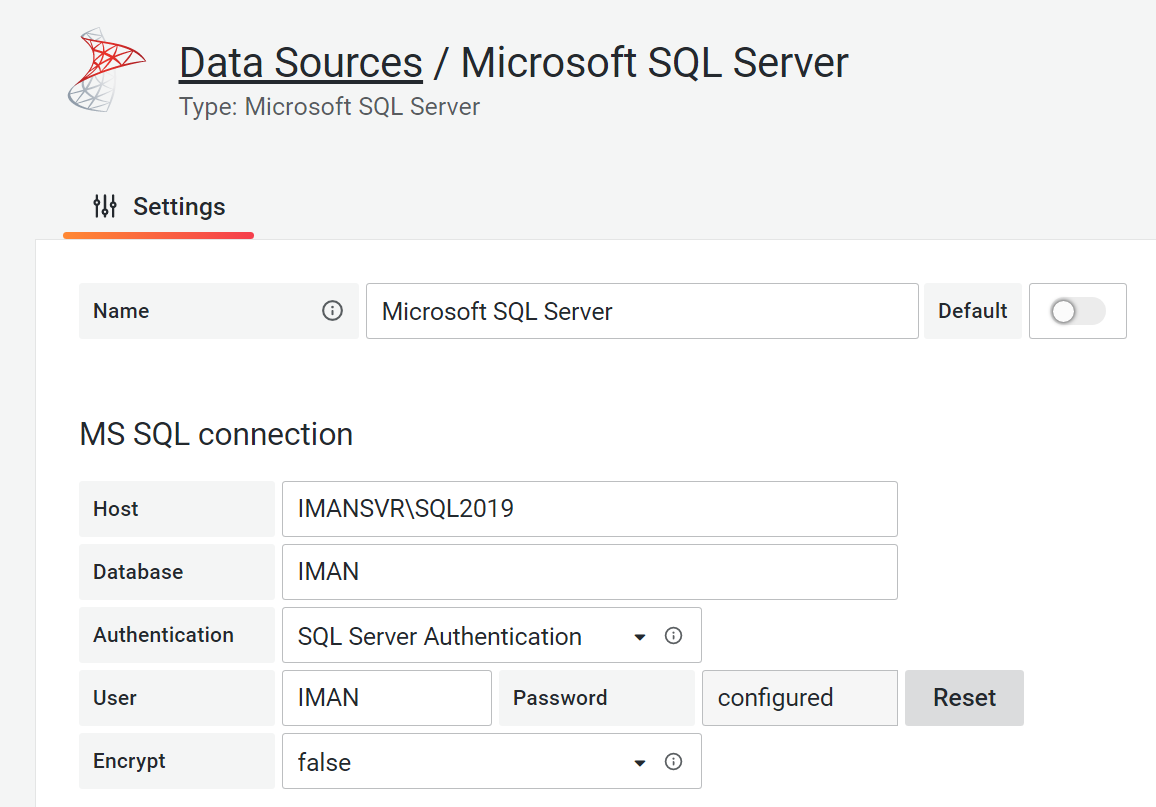
Set the host, the IMan database and the authentication.
-
Save & Test.
Importing the IMan dashboard
A ready-made dashboard ships with IMan.
-
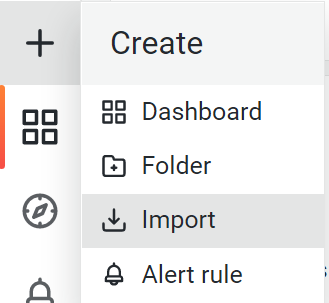
From the left-hand menu choose Add, then Import.
-
Press Upload JSON File and choose
C:\IMan\config\Realisable-WebAPI-Dashboard.json.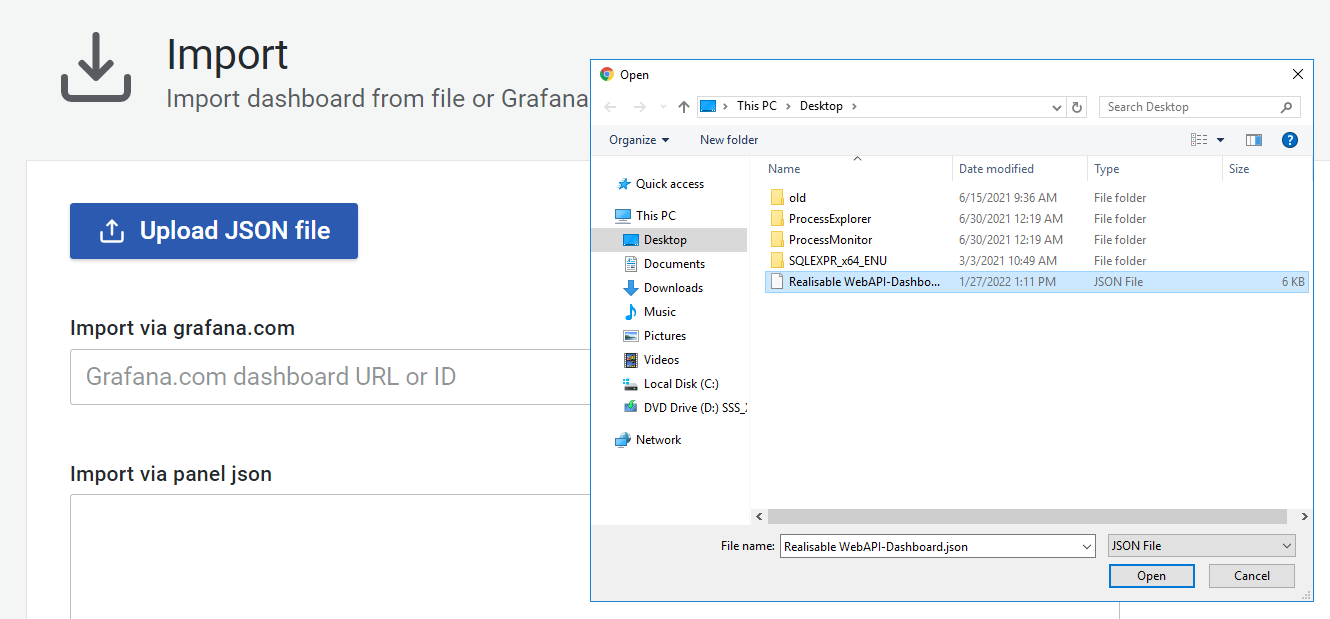
-
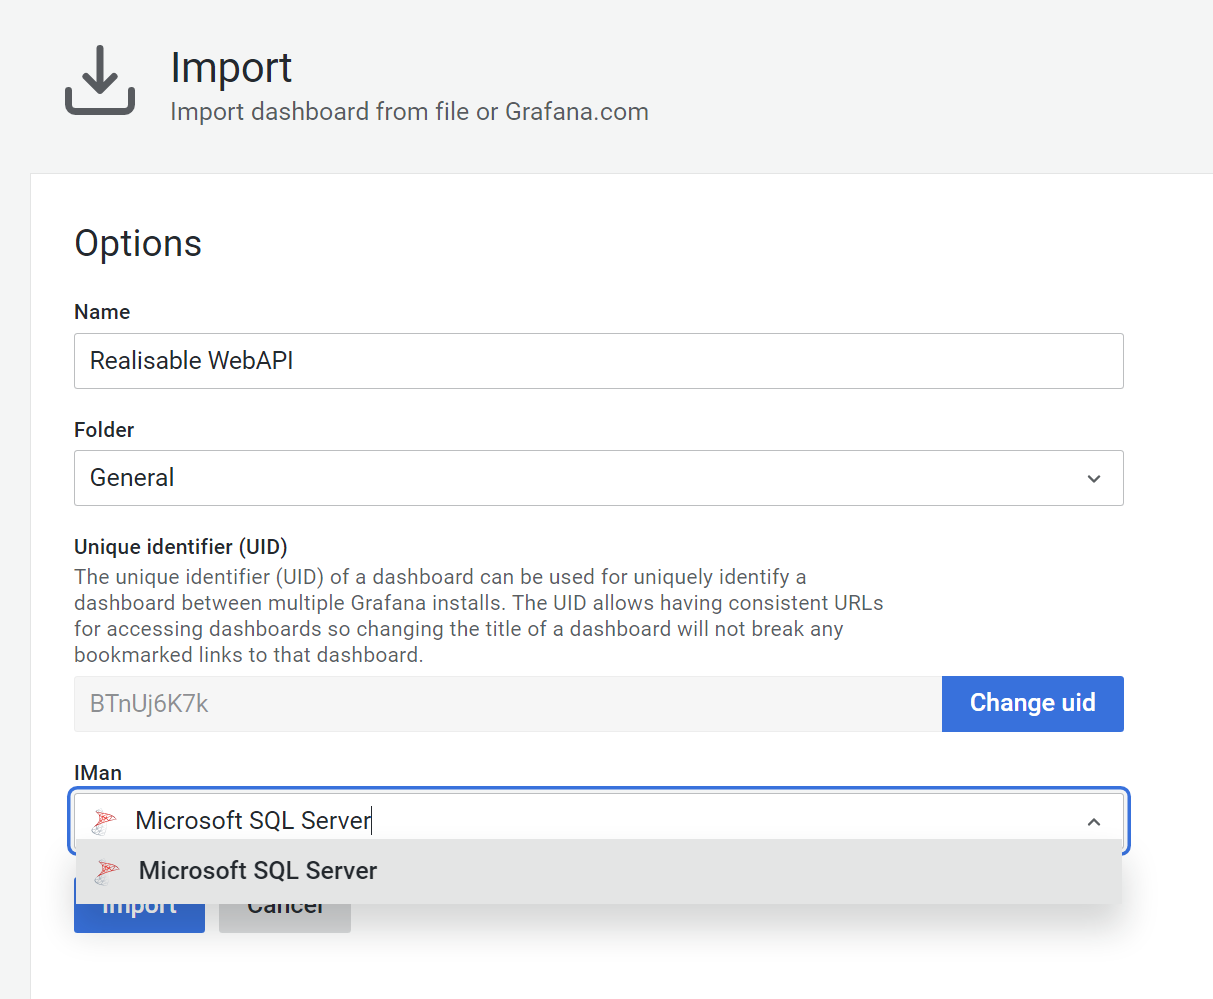
Select the SQL Server data source created above.
-
Press Import. The dashboard opens, and Monitoring WebAPI describes it.