Integration Monitor
The Integration Monitor is a live view of what your integrations are doing: what is running now, what has run recently and how each run turned out. Open it from Integration Monitor in the primary navigation strip.
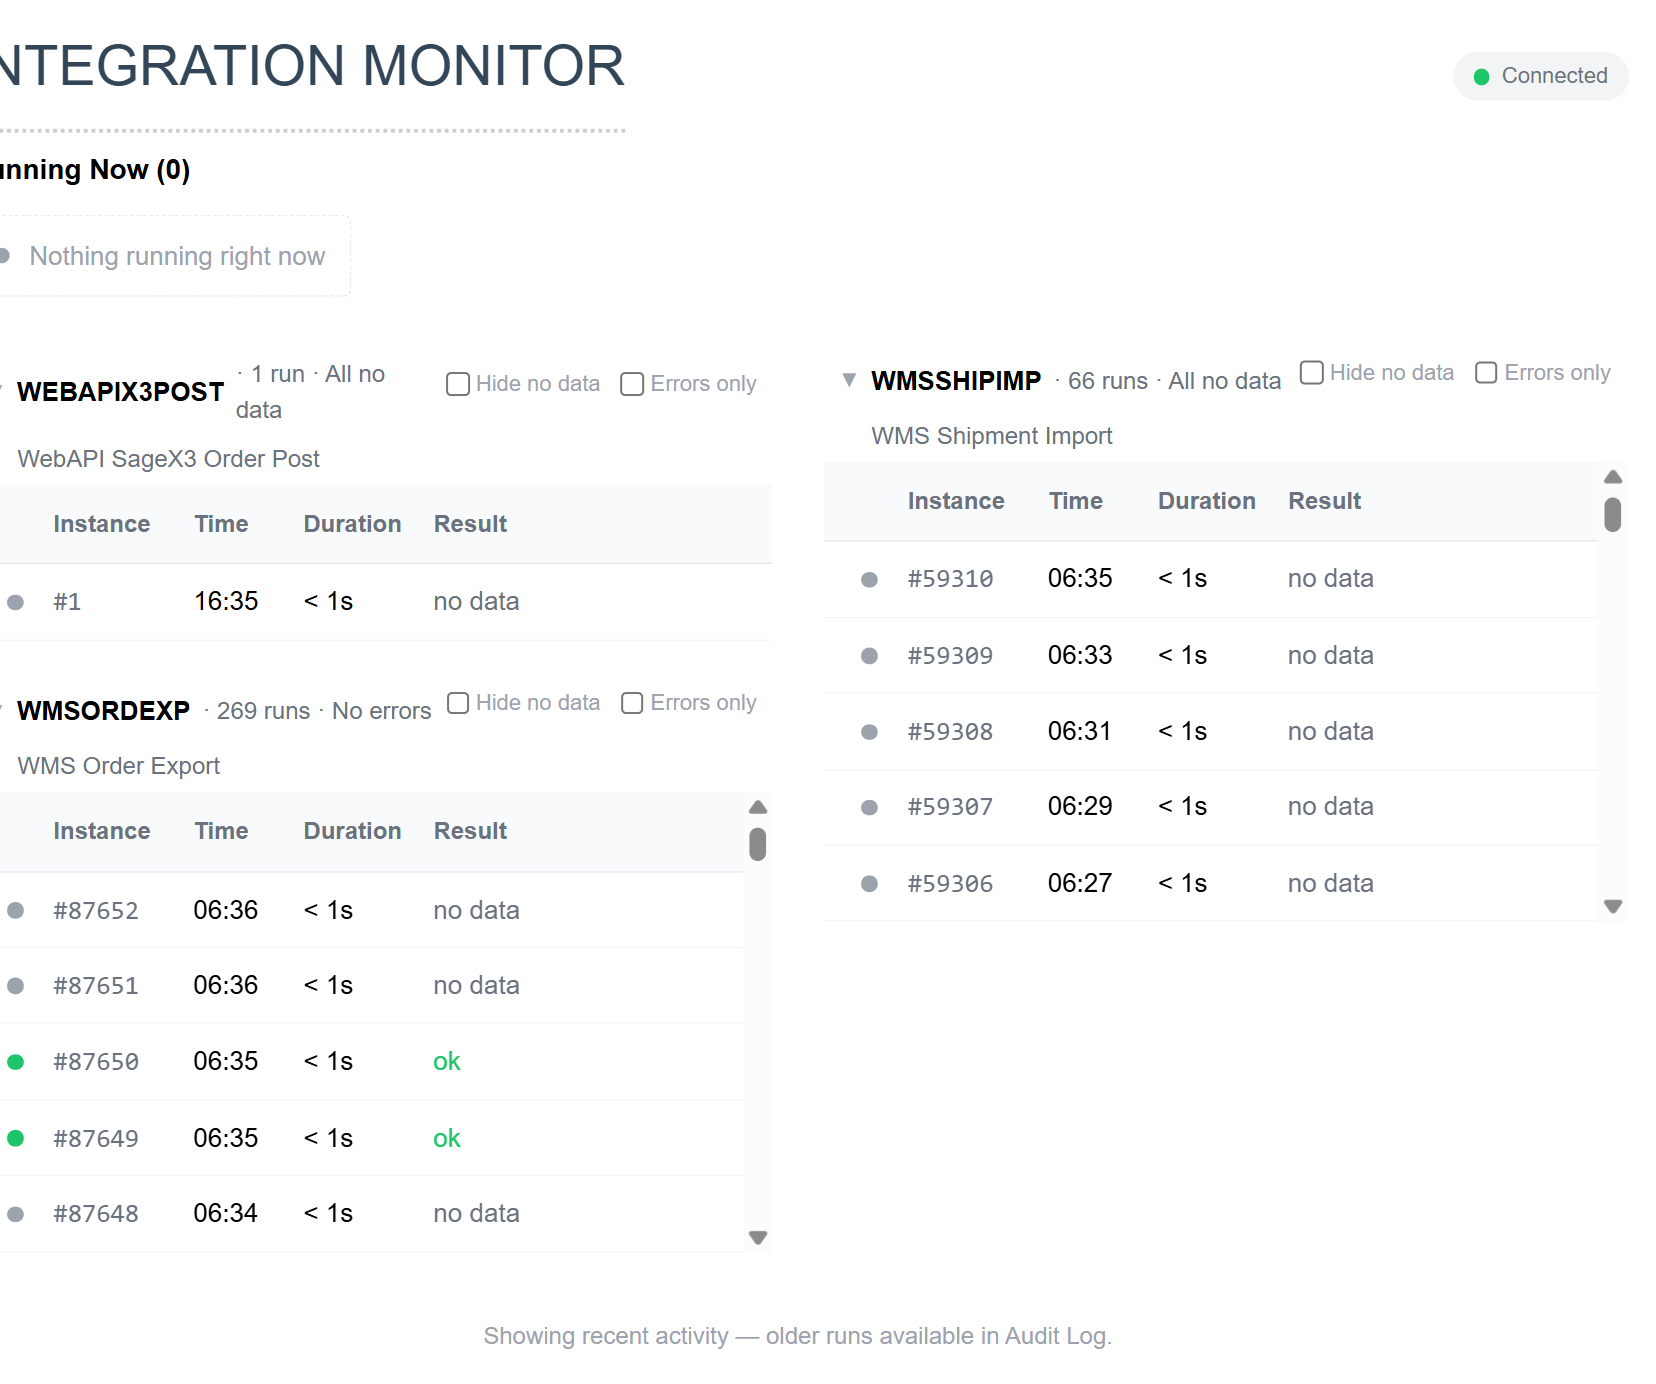
The page updates itself as integrations start and finish, so you do not need to refresh it. The badge in the top right shows the state of the live connection. If the connection drops, the page reconnects automatically and the badge returns to Connected.
Recent activity, not a history
The Monitor shows only recent runs. For anything older, see the audit report. Audit retention (days) on the Scheduling Options screen sets how far back that goes.
Running Now
The strip at the top lists the runs in progress, with the integration, the instance number and the time each one started. When nothing is running, it reads Nothing running right now and stays in place, so the rest of the screen does not move as runs start and finish.
Integration cards
Below the strip is a card for each integration that has reported activity. The card shows the integration's Id, how many runs the Monitor has seen and a one-line summary of how they went: No errors, All no data or the number that failed.
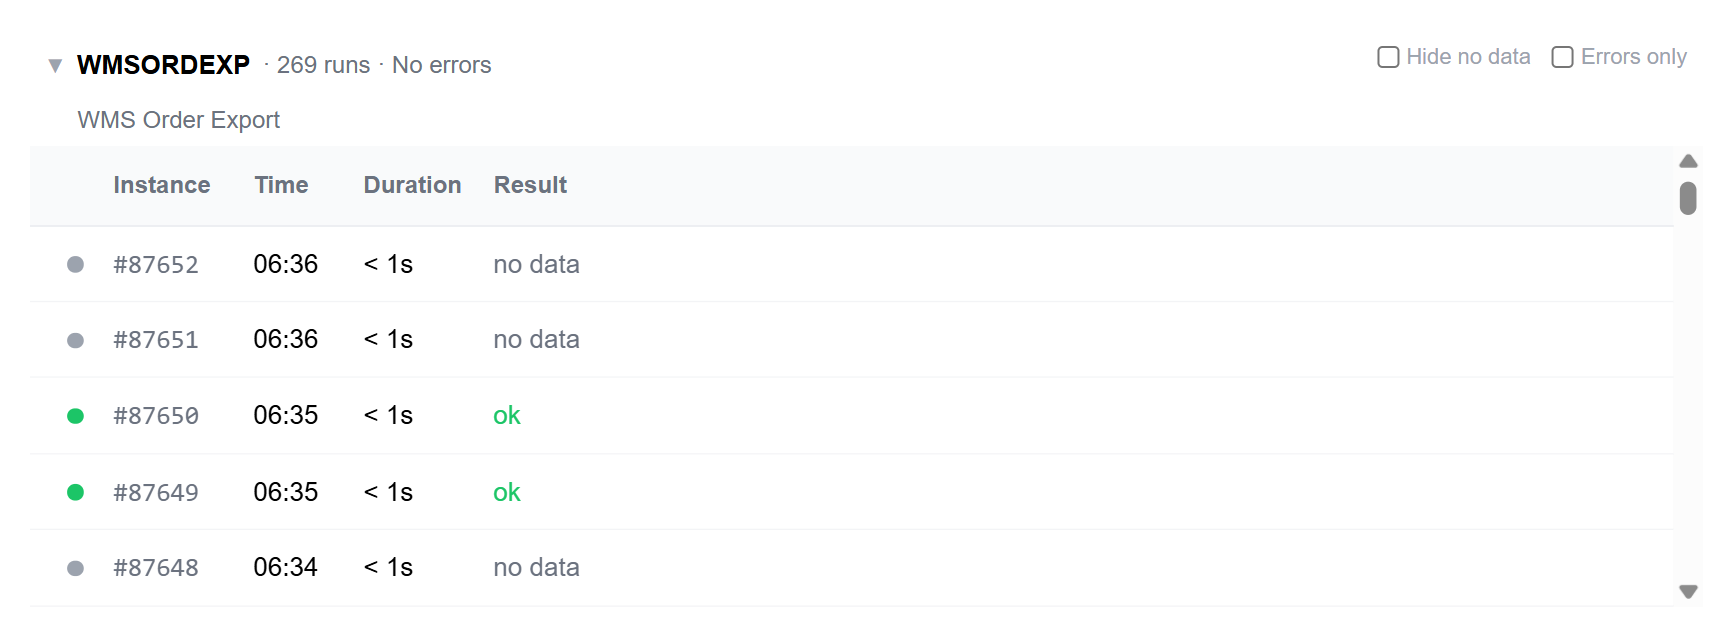
Each row in the card is one run: the instance number, the time it started, how long it took and the result. A coloured dot also shows the result: green for a run that processed data, grey for one that found nothing to do.
Two tick boxes on each card filter the list:
- Hide no data — hides the runs that found nothing to process. On a frequent schedule, this is most of them.
- Errors only — shows only the runs that failed.
Before any integration has reported in, the page reads Waiting for integration events... instead of showing cards.
Looking at a single run
Select a run to open its detail on the same page.
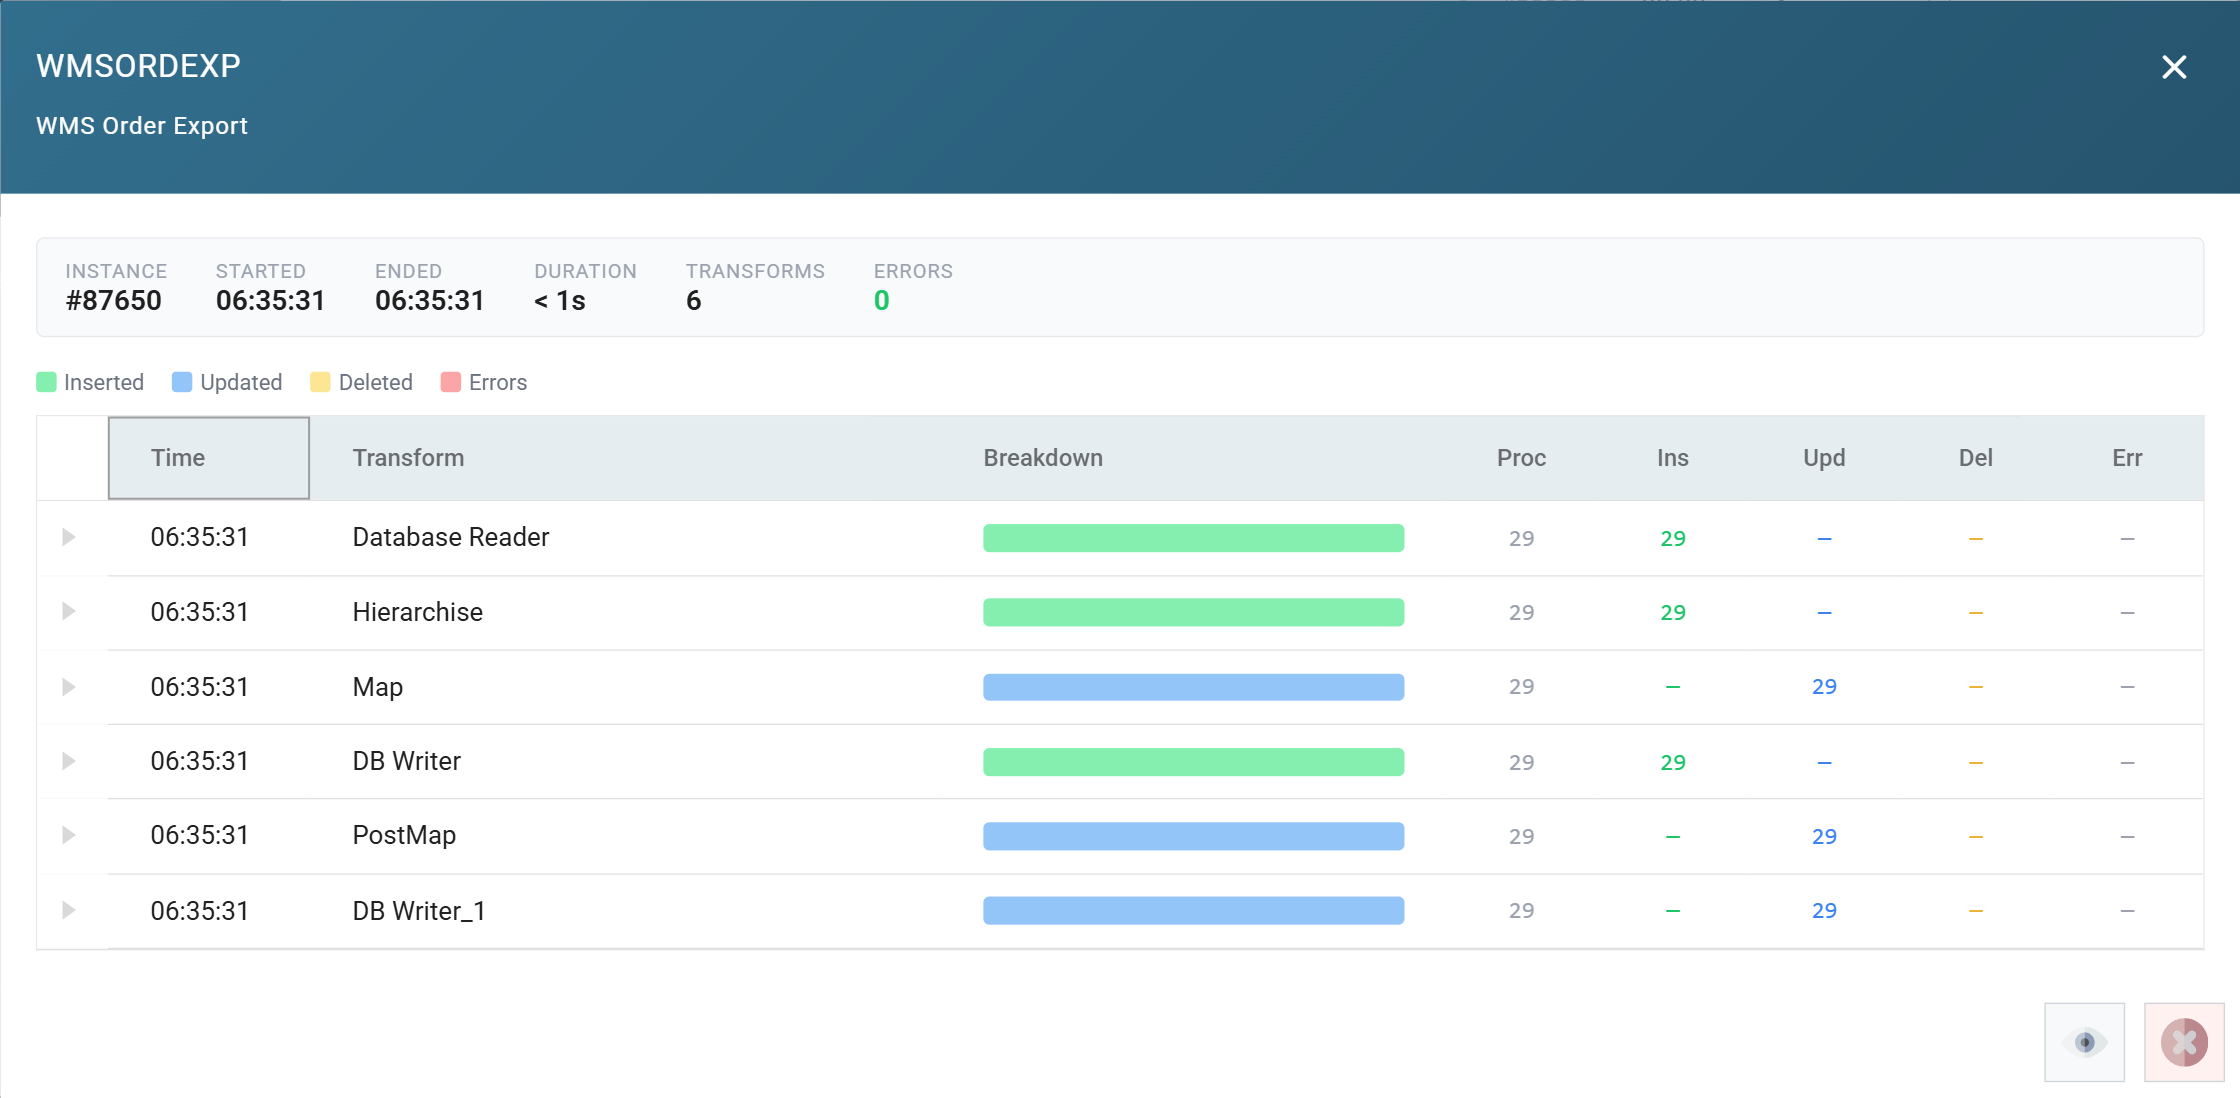
The summary along the top gives the instance number, when the run started and ended, how long it took, how many transforms it ran and how many errors it raised. Below that is a row for each transform in the integration, in the order the transforms ran. Each row has a breakdown bar and the counts of the records the transform processed, inserted, updated, deleted and failed.
The eye icon opens the full audit report for the run. The cross closes the detail and returns to the cards.
Monitors are a different thing
A Monitor starts an integration when an email arrives. The Integration Monitor shows what integrations do once they have started. Despite the similar names, the two are unrelated.