Monitoring & Observability with Grafana
IMan provides realtime API monitoring through the best-in-class Grafana.
Follow the Monitoring Installation & Setup guide before you can use Grafana/monitor your API Endpoints.
IMan currently provides two metrics for each endpoint.
- Request Time in Milliseconds
- Requests per minute (which includes errors per minute)
Logging In
By default Grafana will be hosted on port 3000. Open a web browser and enter (assuming default http://localhost:3000/) into the address.
The default credentials are, but you will have changed the default password during installation.
Default User: admin
Default Password: admin
Monitoring
The standard dashboard is composed of:
- The top section which consists of the response times in millisecond by endpoint.
- The bottom graph shows the number of requests per minute in a single graph.
- The top right drop down (in the screenshot showing ('Last 2 minutes') allows you to change the time span of the graphs.
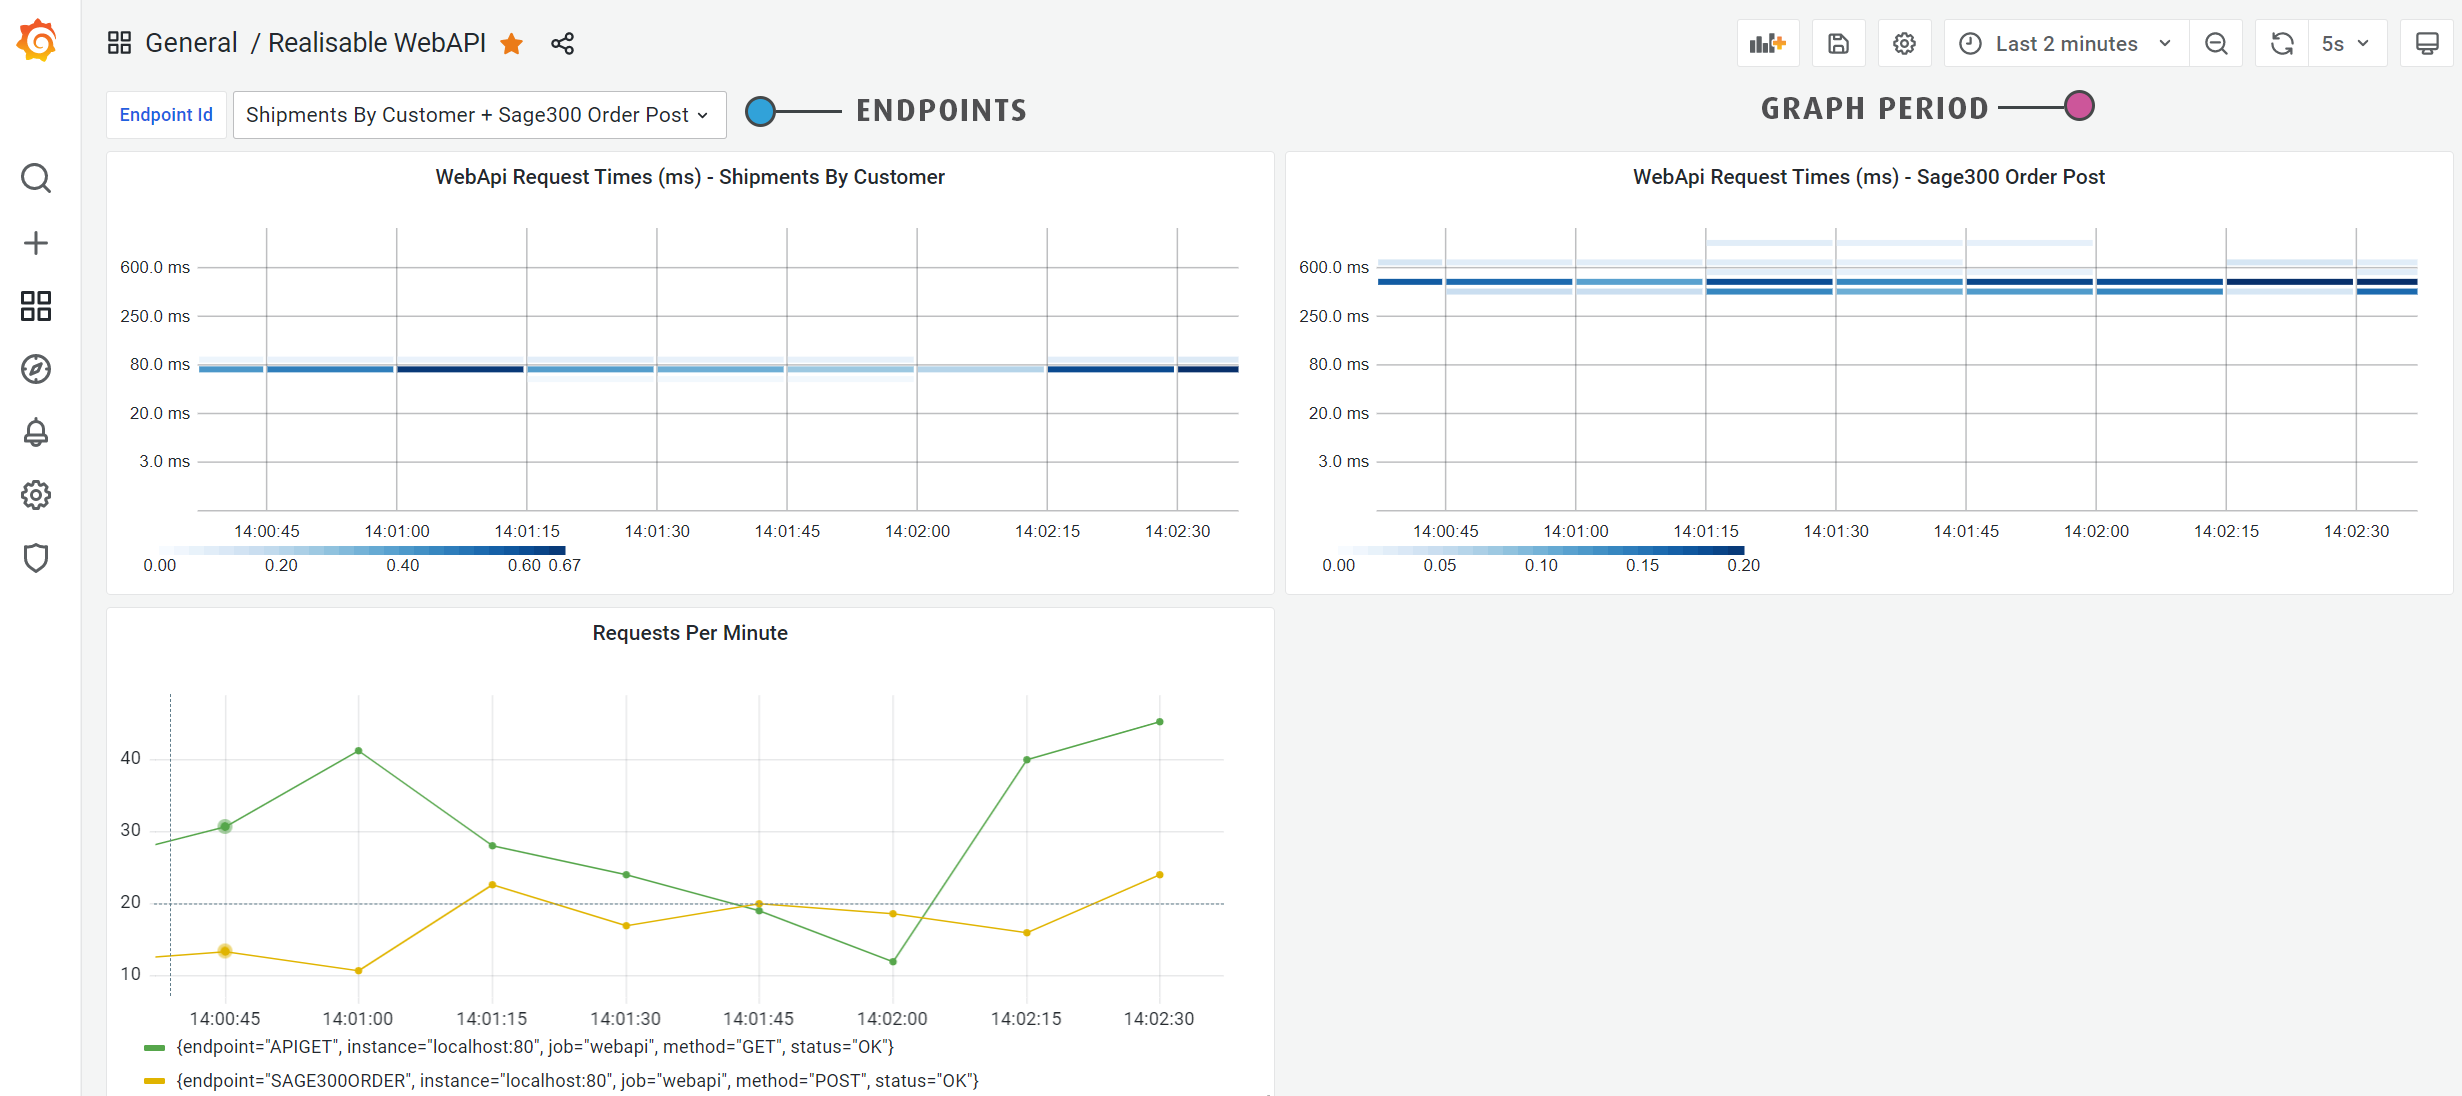
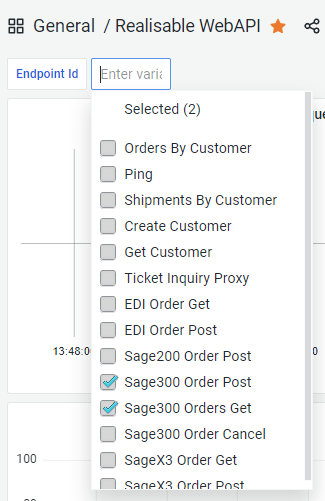
Endpoints
The desired endpoints to monitor can be selected from the Endpoint drop down.