Monitoring Installation & Setup
Monitoring requires two additional open-source software packages to be installed and configured.
- Prometheus
- Provides the metrics gathering from IMan and a time-series database of metrics.
- Grafana
- Provides the graphical front-end/metrics visualisation.
This guide describes the installation, setup & configuration required on a windows server.
These steps assume you are installing Prometheus & Grafana on the same server as IMan.
Prometheus Installation & Configuration
- Download Prometheus from their site.
- Prometheus for windows does not have an installation. So simply unblock, unzip the folder to a desirable location.
- Open prometheus.yml file in route of the unzipped folder in a text editor.
- Add the following at the very end of the file (within the scrape_configs) group.
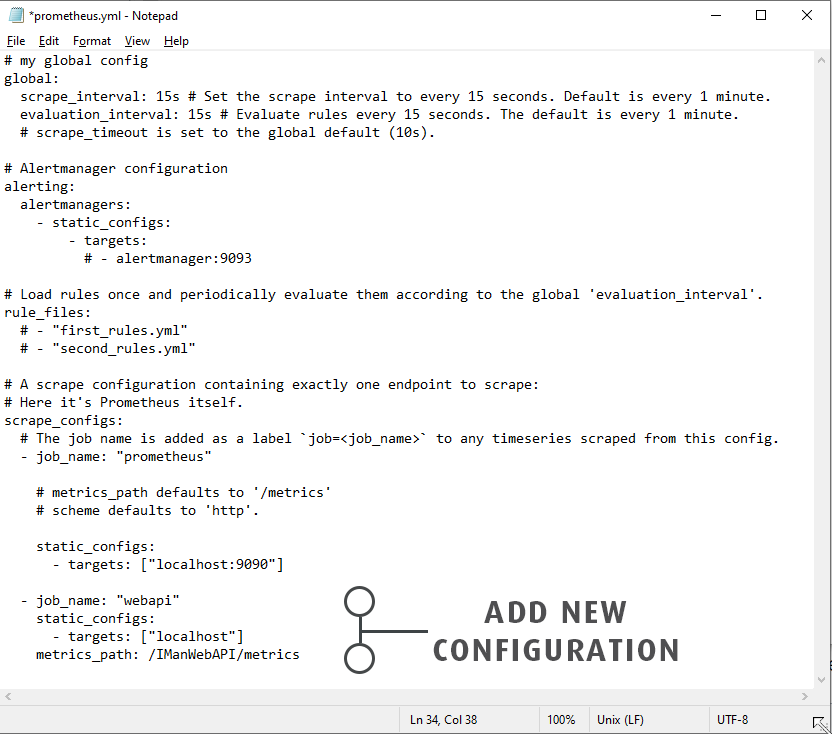
  - job_name: "webapi"
    static_configs:
      - targets: ["localhost"]
    metrics_path: /IManWebAPI/metrics
Running Promethus (as a Service)
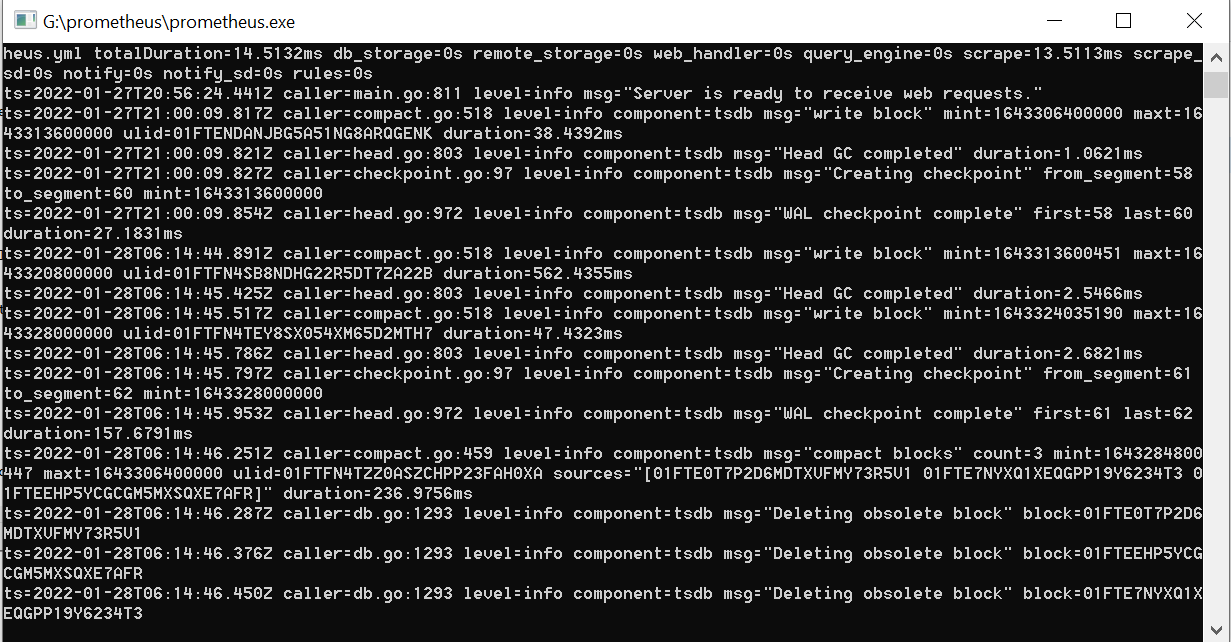
Prometheus must be running for monitoring/Grafana to update/report.
To run Prometheus,run Prometheus.exe found in the root folder.
If you are running IMan in a production scenario we recommend using a program such as Always Up to run Prometheus as a windows service.
Grafana Installation & Configuration
Grafana
- Download & Install Grafana following the instructions from the linked page.
Configuring DataSources
It is necessary to configure two datasources: Prometheus & a SQL Server connection to the IMan database.
Prometheus
- Open a browser (http://localhost:3000) and login to Grafana (User: admin, Password: admin).
- Go to the Datasources menu.
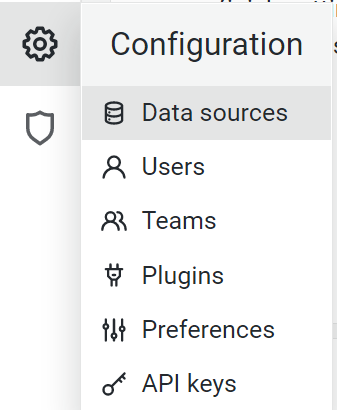
- Add a Prometheus Datasource.
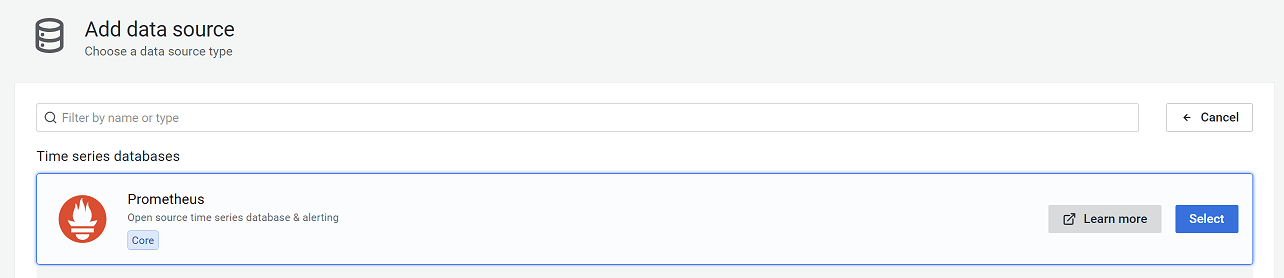
- The key configuration is the URL. If Grafana is being installed on the same server as Prometheus with the default settings will be sufficient.
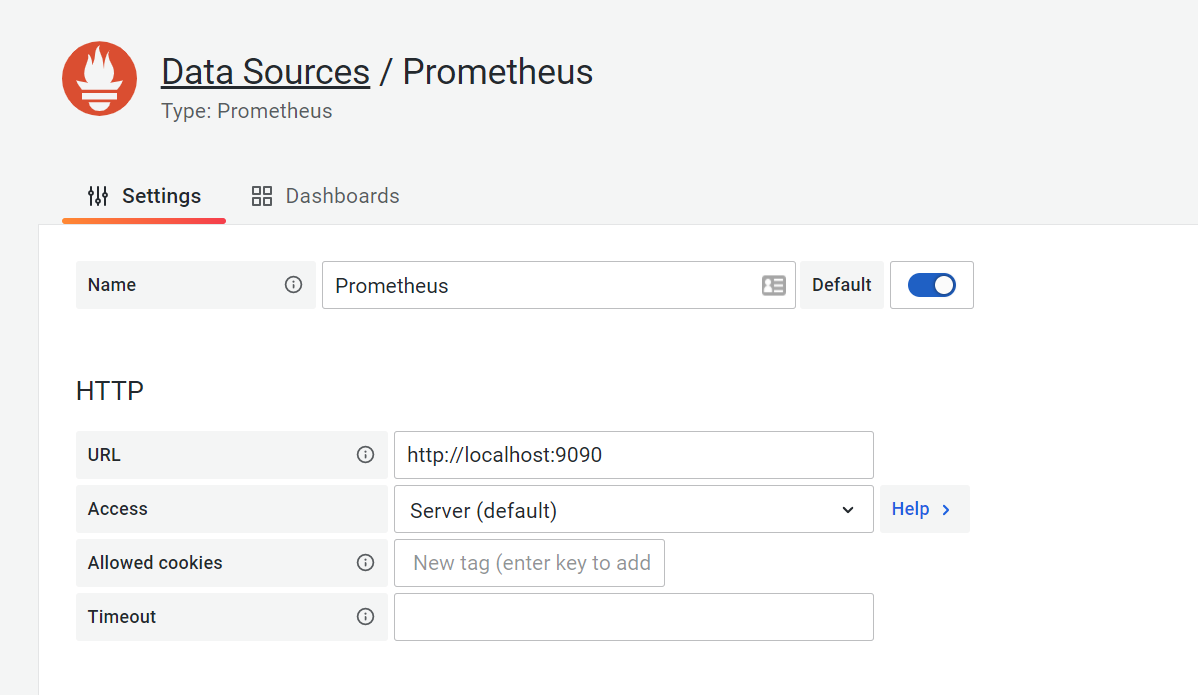
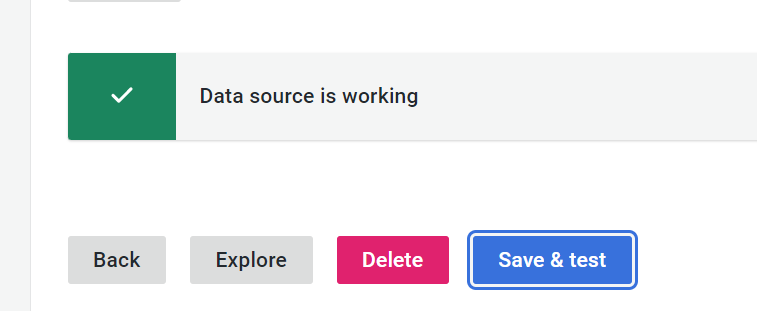
- Press Save & Test.
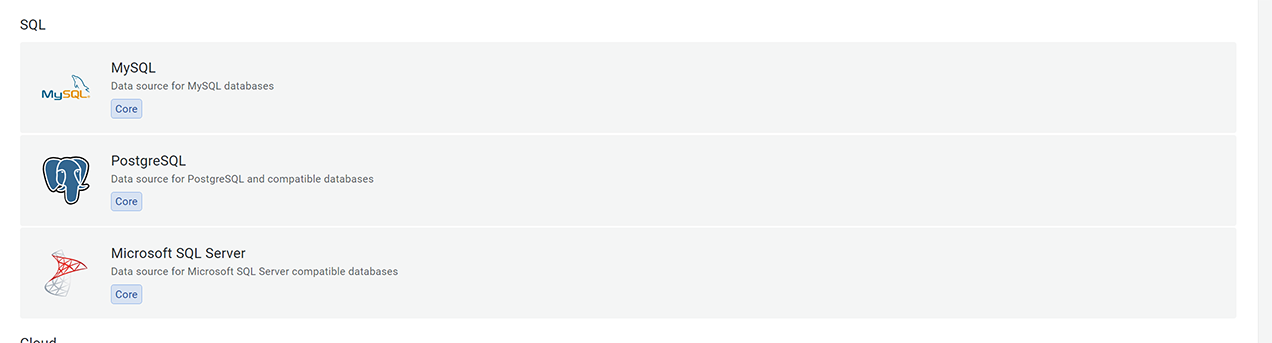
IMAN SQL SERVER DATASOURCE
To provide the list of endpoints, the Grafana dashboard requires a connection to the IMan database.
- Add a SQL Datasource (SQL Datasources are 2/3rds the way down the page).
- Set the host, database and authentication details.
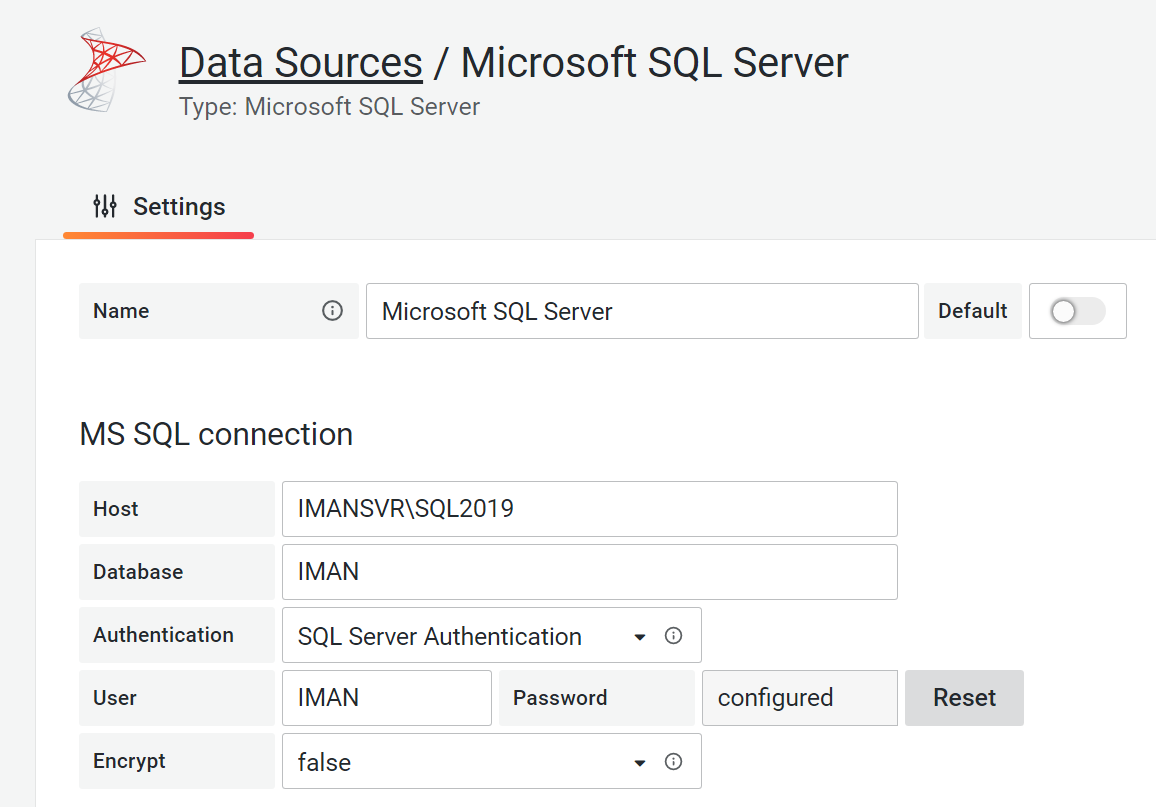
- Save and test.
Importing IMan Dashboard
We have a preconfigured dashboard.
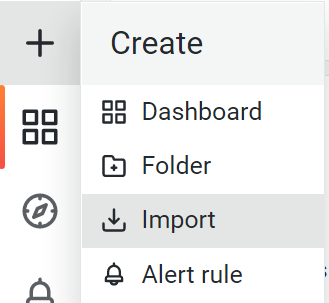
- From the left hand menu, select the Add option and then Import.
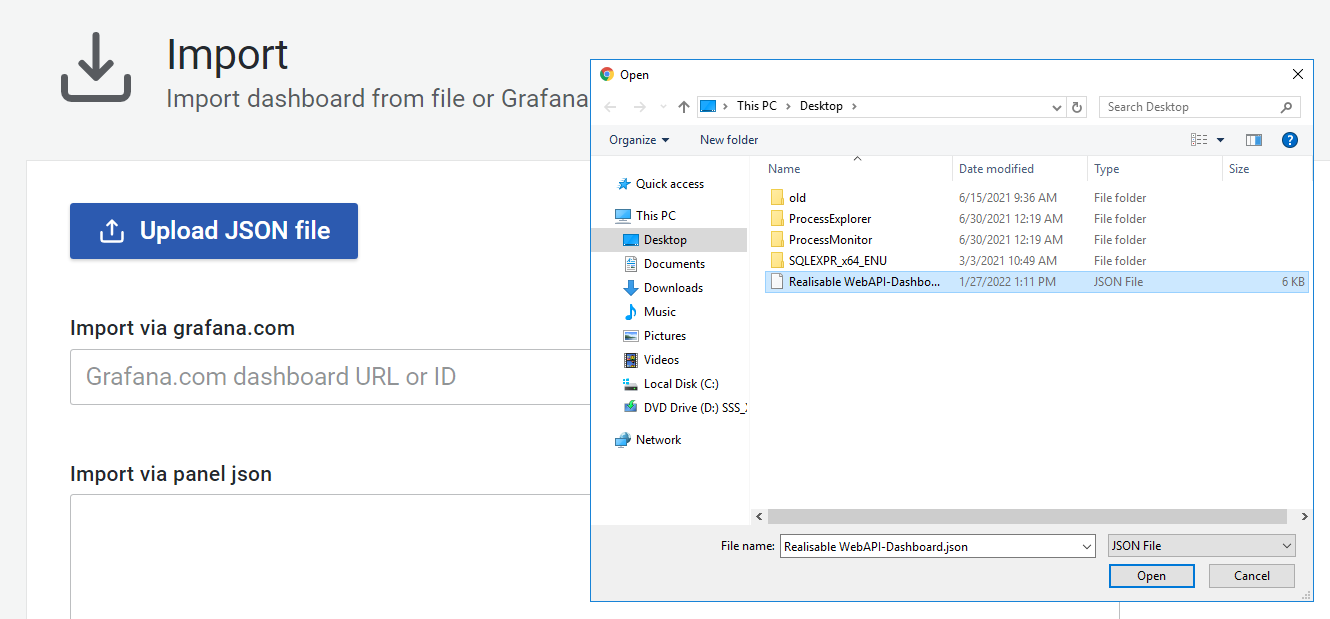
- Press the Upload JSON File and browse the dashboard file (C:\IMan\config\Realisable-WebAPI-Dashboard.json).
- Select the SQL server datasource created in the step above.
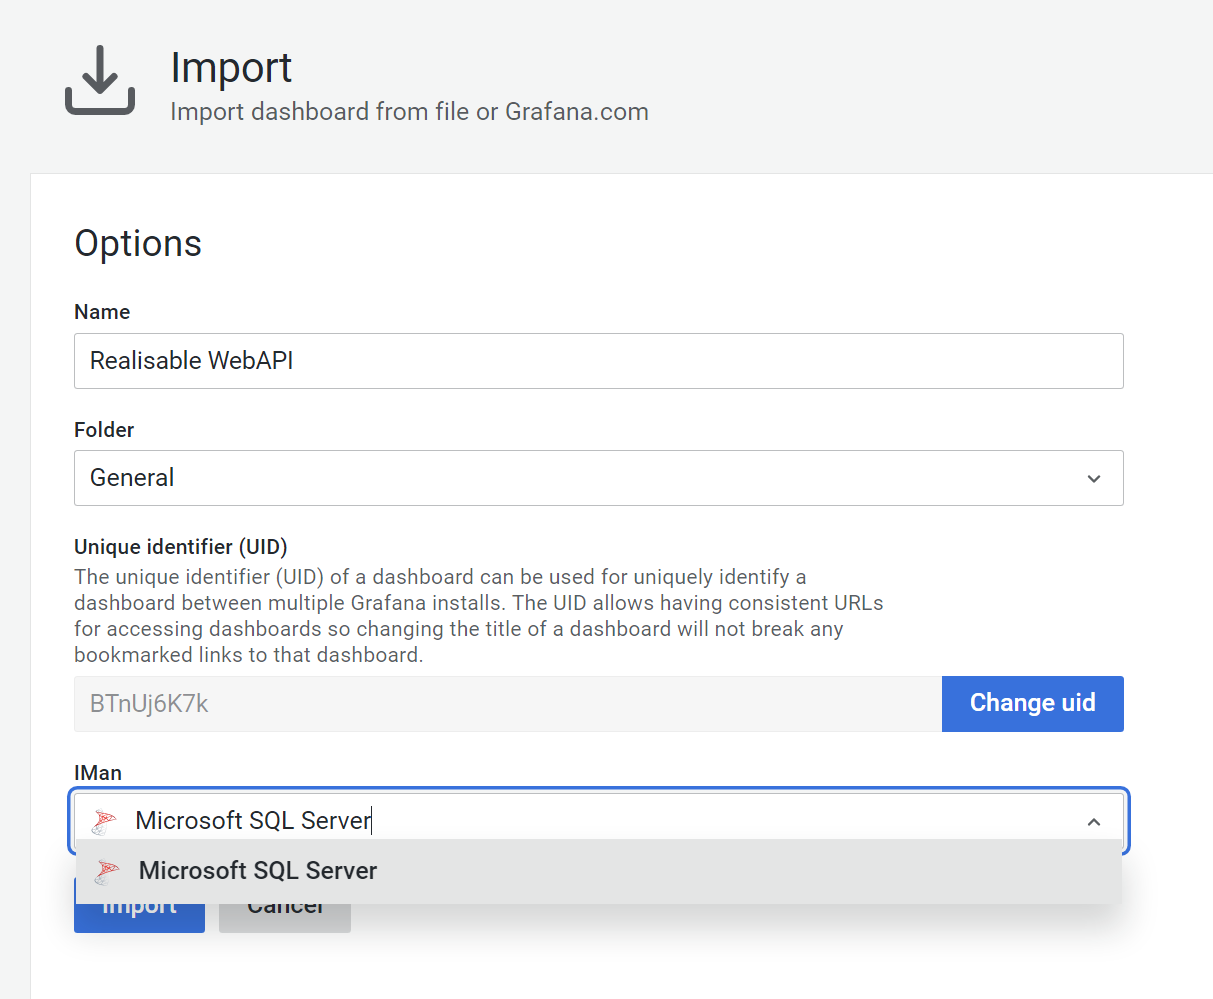
- Press Import. If successful you will be shown the Dashboard.